
Sylnovia © 2026 · All Rights Reserved

Deploying code to production without comprehensive observability is like flying an airplane in a storm with blindfolds on. Users encounter broken checkout buttons, database deadlocks occur, and API latency spikes, yet the engineering team remains completely unaware until an executive receives an angry phone call from an enterprise client.
Modern production engineering demands Observability—the capability to infer the internal health and performance of distributed systems based on external telemetry data.
Continuous measurements of system vitals over time (CPU utilization, memory consumption, request throughput, HTTP error rates, database connection counts). Tracked via tools like Datadog or Prometheus to trigger automated alerts when anomalies breach thresholds.
Structured JSON event records emitted by applications. Centralized log aggregation (Elasticsearch/Logstash, Datadog Logs, AWS CloudWatch) allows engineers to query and filter millions of log lines across dozens of servers in seconds.
In microservices architectures, an HTTP request may traverse an API gateway, an auth service, a billing worker, and a database. Distributed tracing passes a unique trace ID across all network boundaries, visualizing the exact waterfall latency breakdown of each hop.
At Sylnovia, we configure enterprise observability stacks that catch bugs before customers notice and provide actionable intelligence. Partner with our Site Reliability Engineering (SRE) specialists to secure your application's uptime.
Delivering deep technical insights, architectural blueprints, and digital strategy for modern engineering squads.

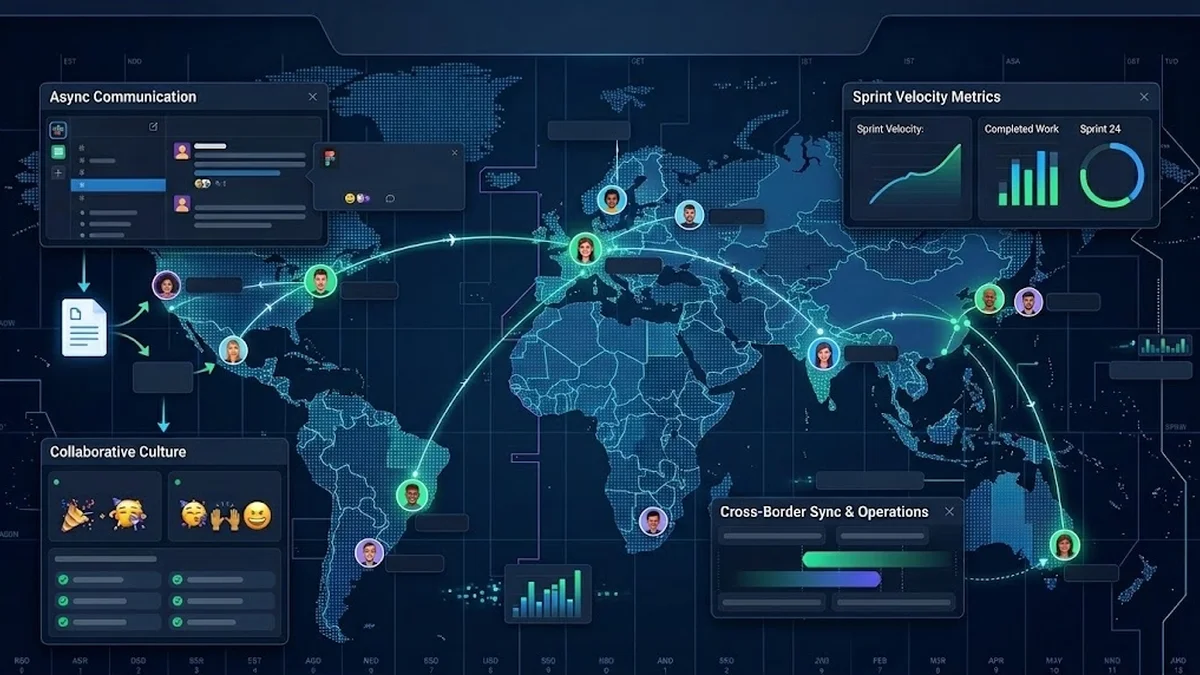
The Strategic Hiring Dilemma for Growing Businesses When leadership teams decide to build a custom software platform or...
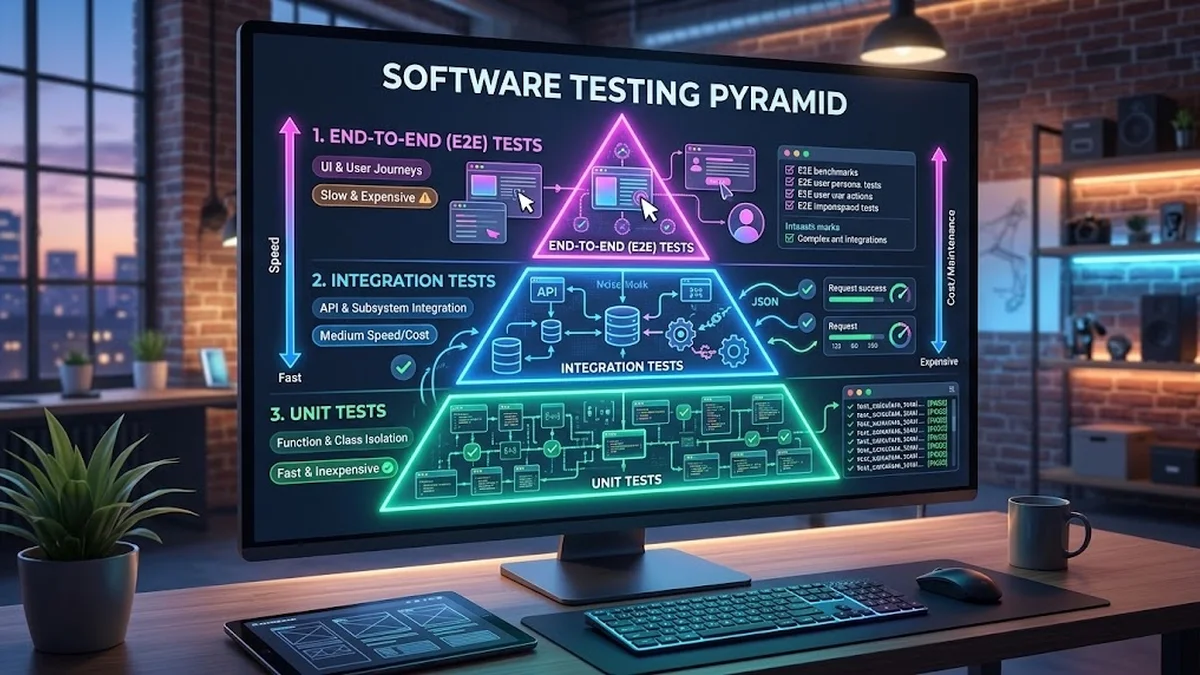
The False Dichotomy of Manual vs. Automated QA In software engineering discussions, testing is often framed as an all-o...
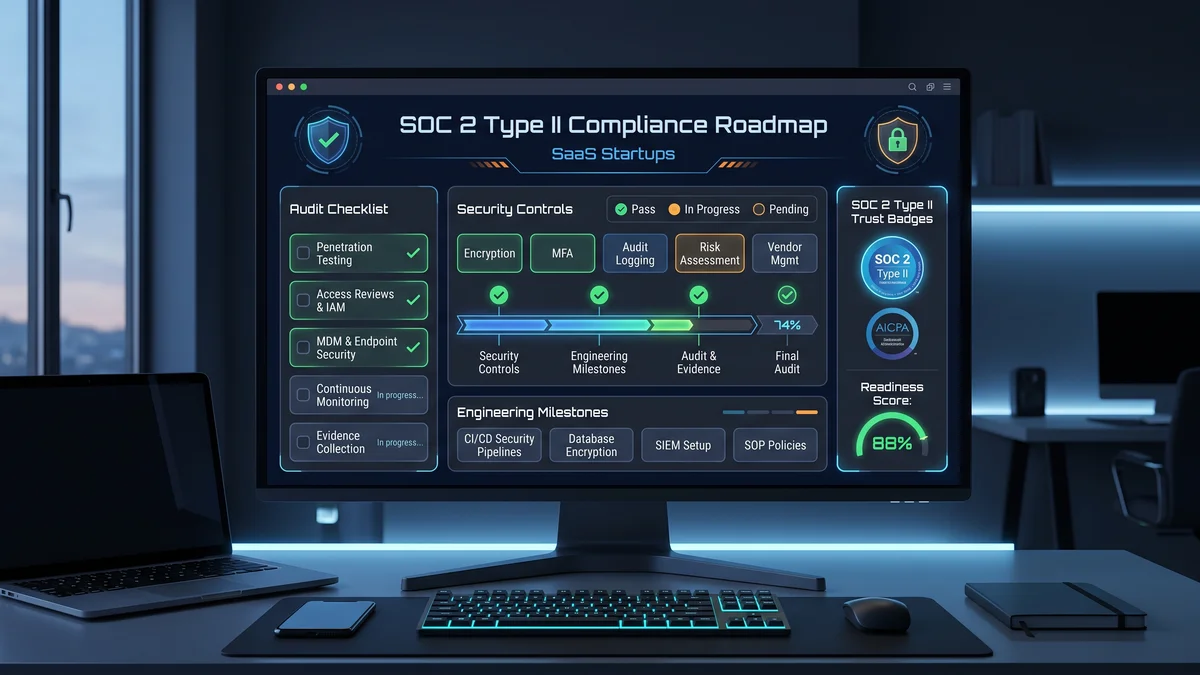
Why Enterprise B2B Buyers Mandate SOC 2 Type II When selling software to Fortune 500 enterprises, healthcare organizati...